I've been playing with this map for two days trying to get a better understanding of the polar vortex that has us Americans freezing our collective butts off right now. As with anything, it's easy to see the answer when I know what I'm looking for - Arctic air dipping deep into the middle of the United States. But it's much more difficult when I don't know what I'm looking for -what the polar vortex looks like on days when we're not gutting our taun tauns- and when there's a lot of oversimplified and/or misleading information.
What I want is to see it, so I'm using a map called, I think, earth, built by a web developer named Cameron Beccario, who was inspired by the Wind Map we last looked at here in the lead-up to Hurricane Sandy. But Beccario has taken the Wind Map to a whole new level by offering it world-wide on a variety of map layouts and with options for different altitudes and dates. The data, drawn from NCEP, the National Weather Service, and NOAA, updates every three hours.
Surely, if there's any place I'm going to be able to "see" the polar vortex it'll be here.
Of course, like you, I've seen the scoop-neck purple-blue tie dye t-shirt U.S. maps over the past couple of days, so I think I already know what the vortex looks like. I'm looking for some kind of U shape dipping deep through the middle of the country.
Right?
I'm not as sure as I was when I started this, so hopefully someone who knows better will offer some clarification to what I have to present.
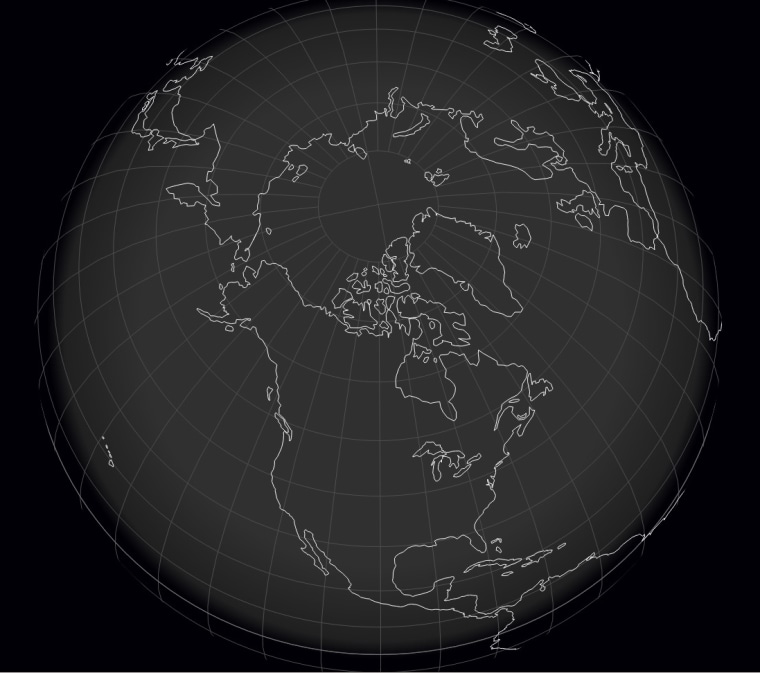
First, if you look on the right there you'll see a blank map to show how I have aligned the following maps. Once it's covered in lines and colors it can be hard to tell what we're looking at (although I find it helpful to look for the Great Lakes) so use that for reference.
Let's begin with Monday's map, when the cold air was on its way from its usual route around the North Pole. The map's "about" page tells me that 500 hPa is where "vorticity" happens. Vorticity sounds like a good place to look for a vortex. (hPa stands for hectopascals, which is the same as millibars, but apparently millibar is not an official unit of measure. But note that we're not exactly measuring height above the Earth's surface here, we're measuring air pressure, and that corresponds with altitude.)
The other reason 500 hPa sounds good is that that's where Rossby waves are. So you wanna see meanderings in the jet steram that pull off chunks of arctic air? Do you see anything familiar in this diagram? Also, the Washington Post's Capital Weather Gang's "deep dive" on the polar vortex bases its explanation around 500 mb.
Ok, so here it is, January 6 at 500 hPa:
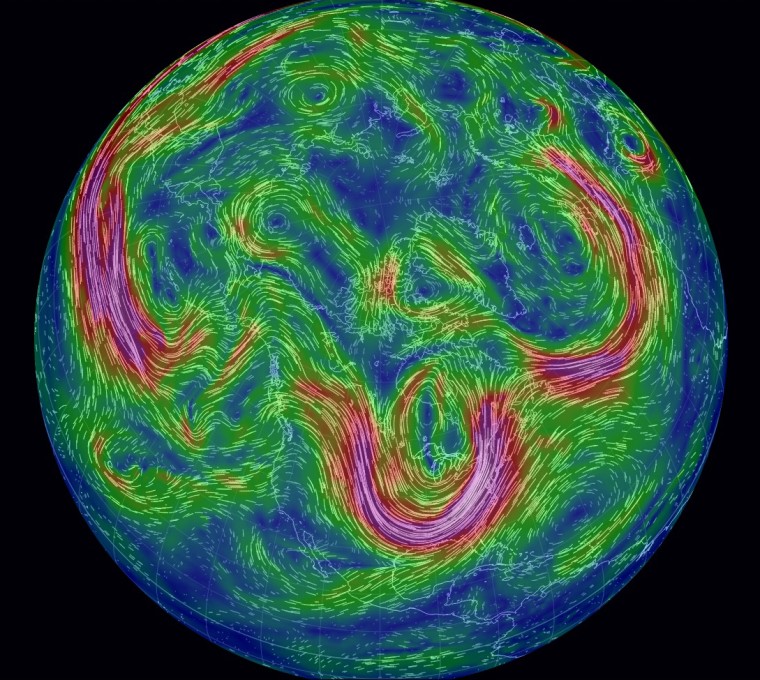
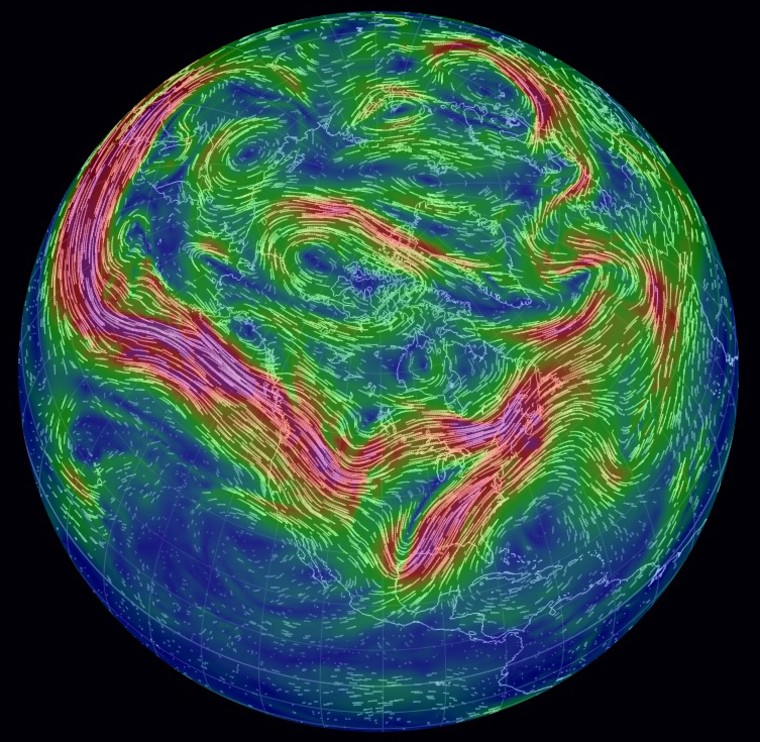
Look at that U! Surely that's it! Not only that, but if I push the forecasting supercomputer ahead to January 11th, I not only see the cold air mostly moving across Canada, as opposed to dipping to the U.S., but I see a new flow of air coming from the south, lending credence to the 54° forecast for New York City Saturday:
And so, if I go back, say, a week, to before this weather developed, will I see a less unusual polar vortex? Here's December 29, 2013 at 500 hPa:
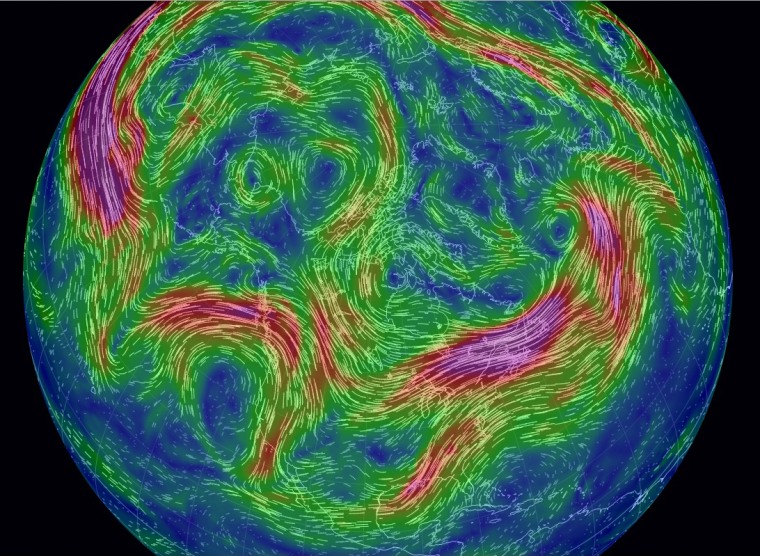
December 29, 2013:
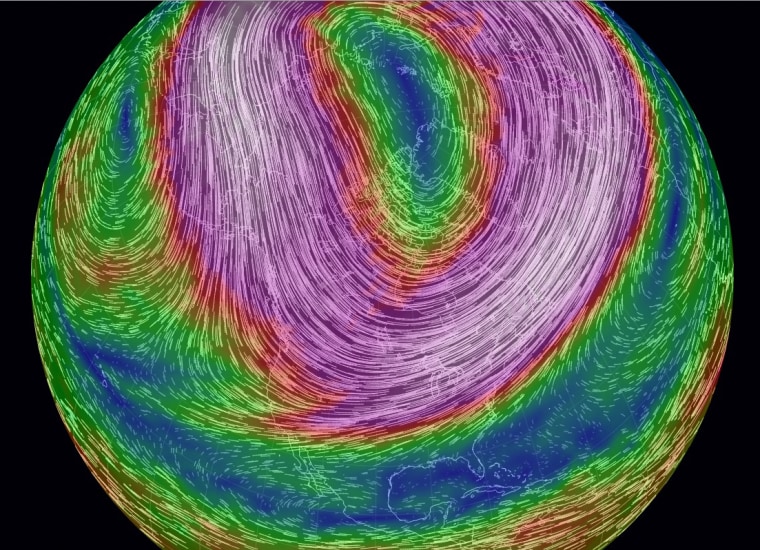
January 6, 2014:
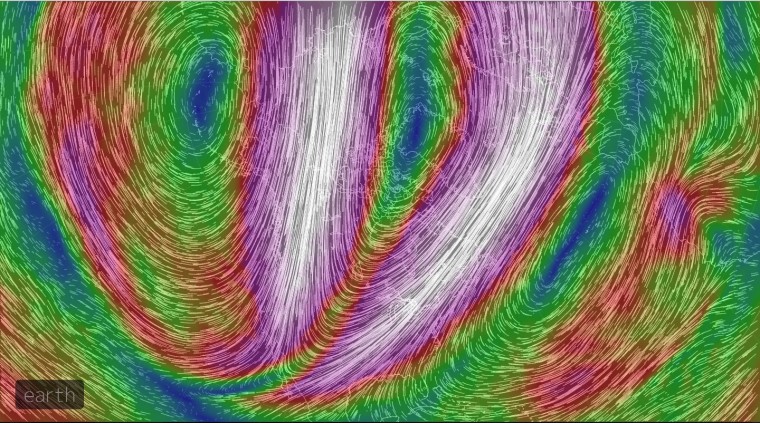
Wow! Not only does that look more like a single vortex, but the distortion over North America this week is still evident.
So the way I'm explaining this to myself is that this more simple pattern at the lower pressure is the polar vortex. The more complicated patterns at 500 hPa is the weather created by the polar vortex.
A few of the explanations I read talked about this week's cold being the result of a weakening of the vortex, possibly caused by heat from the summer ice melt. Would that stripe of slower wind speed breaking the loop over the Midwest be representative of that weakening?
I know there's someone reading this who understands all of this much better than I do. I welcome any elucidating insights.