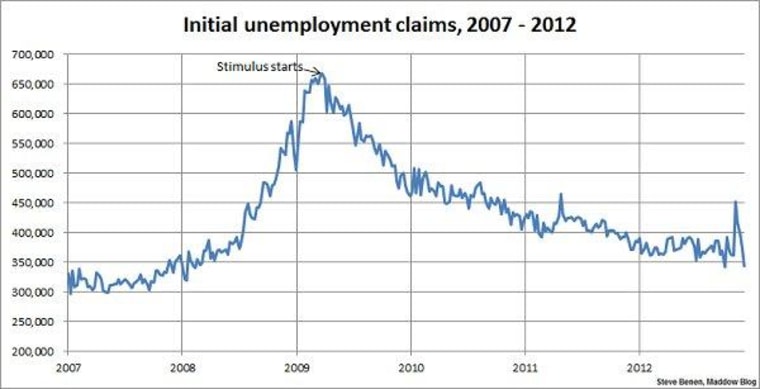
With the economic effects of Hurricane Sandy starting to subside, it was widely expected that we'd see an improvement in initial unemployment claims, but few thought the new report from the Department of Labor would be this good.
New applications for U.S. unemployment benefits fell by 29,000 to a seasonally adjusted 343,000 in the week ended Dec. 8, putting claims at the second lowest level of the year, the Labor Department said Thursday. Initial claims from two weeks ago were revised up to 372,000 from an original reading of 370,000, based on more complete data collected at the state level. Claims are now below pre-Sandy levels and near their lowest point in about four years. Economists surveyed by MarketWatch expected claims to decline to 370,000.
To put this in perspective, this new weekly total matches the best unemployment-claims report since President Obama took office nearly four years ago. It exceeds expectations in a very encouraging way, though Congress may yet screw things up.
To reiterate the point I make every Thursday morning, it's worth remembering that week-to-week results can vary widely, and it's best not to read too much significance into any one report.
In terms of metrics, when jobless claims fall below the 400,000 threshold, it's considered evidence of an improving jobs landscape, and when the number drops below 370,000, it suggests jobs are being created rather quickly. We've been below the 370,000 threshold just three of the last seven weeks, though the further we get from Sandy, the more these figures should improve.
Above you'll find the chart showing weekly, initial unemployment claims going back to the beginning of 2007. (Remember, unlike the monthly jobs chart, a lower number is good news.) For context, I've added an arrow to show the point at which President Obama's Recovery Act began spending money.
