After some steady recent progress on initial unemployment claims, a new report from the Department of Labor this morning was the worst in two months. There is, however, a hurricane-related explanation for the discouraging news.
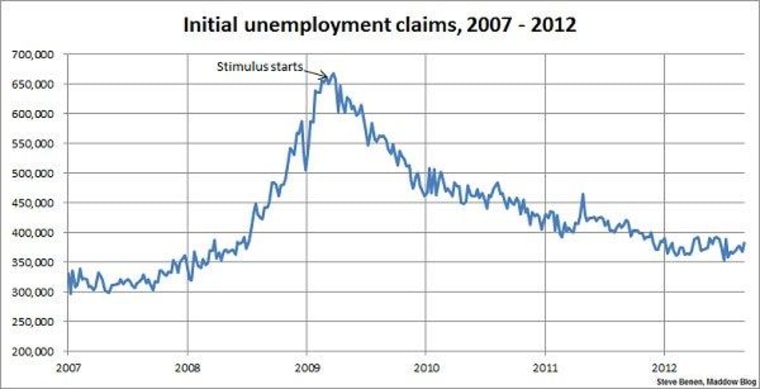
Applications for U.S. jobless benefits jumped by 15,000 to a seasonally adjusted 382,000 in the week ended Sept. 8,, with about half the increase related to tropical storm Isaac, the Labor Department said Thursday. That's the highest level of claims since mid-July. The government said about 9,000 claims stemmed from the storm that passed through the Gulf Coast in late August. Some people could not work because of storm damage, but they did not apply for benefits right away. Economists surveyed by MarketWatch expected claims to rise to 370,000.Initial claims from two weeks ago were revised up to 367,000 from an original reading of 365,000, based on more complete data collected at the state level. The average of new claims over the past month, meanwhile, rose by 3,250 to 375,000, also the highest level since mid-July.
To reiterate the point I make every Thursday morning, it's worth remembering that week-to-week results can vary widely, and it's best not to read too much significance into any one report.
In terms of metrics, when jobless claims fall below the 400,000 threshold, it's considered evidence of an improving jobs landscape, and when the number drops below 370,000, it suggests jobs are being created rather quickly. We've only managed to dip below the 370,000 threshold seven times in the last 23 weeks, but we've dipped below 370,000 in six of the last 10 weeks.
And with that, here's the chart showing weekly, initial unemployment claims going back to the beginning of 2007. (Remember, unlike the monthly jobs chart, a lower number is good news.) For context, I've added an arrow to show the point at which President Obama's Recovery Act began spending money.
