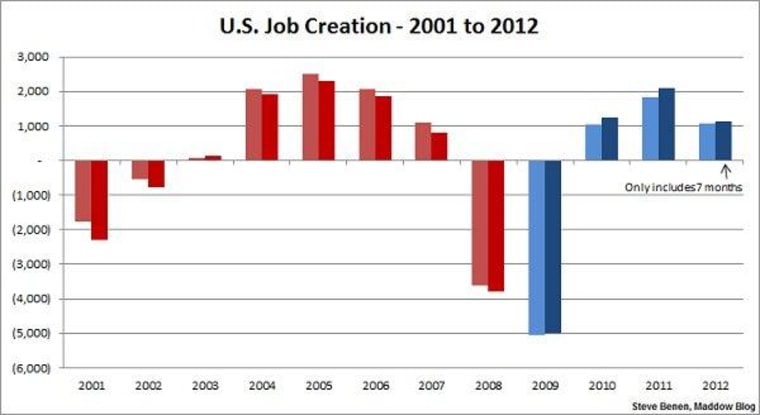
Just for fun, I thought I'd post one more jobs chart, following up on the earlier item. This one shows job growth by year going back to 2001. The blue columns point to President Obama's term, while the red columns point to the Bush/Cheney era, and just as importantly, the lighter color refers to the overall jobs picture, while the darker color points only to the private sector.
So far in 2012, from January to July, the overall economy has added 1.06 million jobs, while the private sector has added 1.12 million jobs. Note that in every year of the Obama presidency, the private sector outpaced the overall economy, while in every year under Bush, that notorious Marxist, the private sector trailed the overall job market.
And while job growth has been underwhelming in 2012, the year to date -- which, again, only includes seven months -- has outpaced the first three years of the Bush presidency combined. Indeed, we've seen more jobs created since January than in five of the eight years Bush was in office.
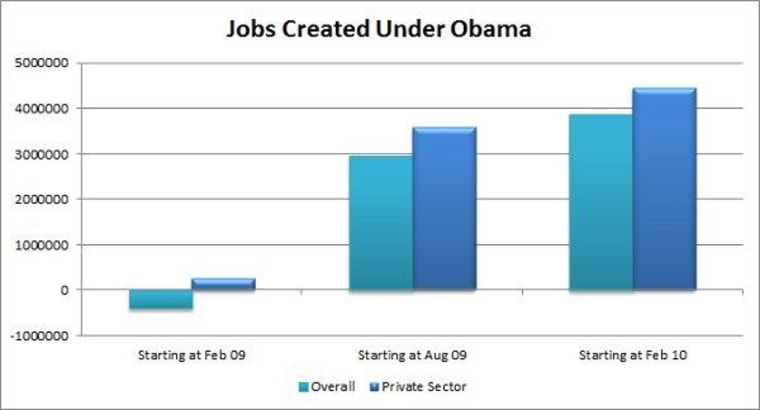
What's more, the chart should also make it obvious that economic conditions have vastly improved since 2009, when Obama took office. In fact, what the hell, let's throw one more chart into the mix. Mitt Romney recently said the first 6 to 12 months shouldn't be held against a new president. If that's true, Obama has created 3.88 million jobs overall, and 4.44 million private-sector jobs.

