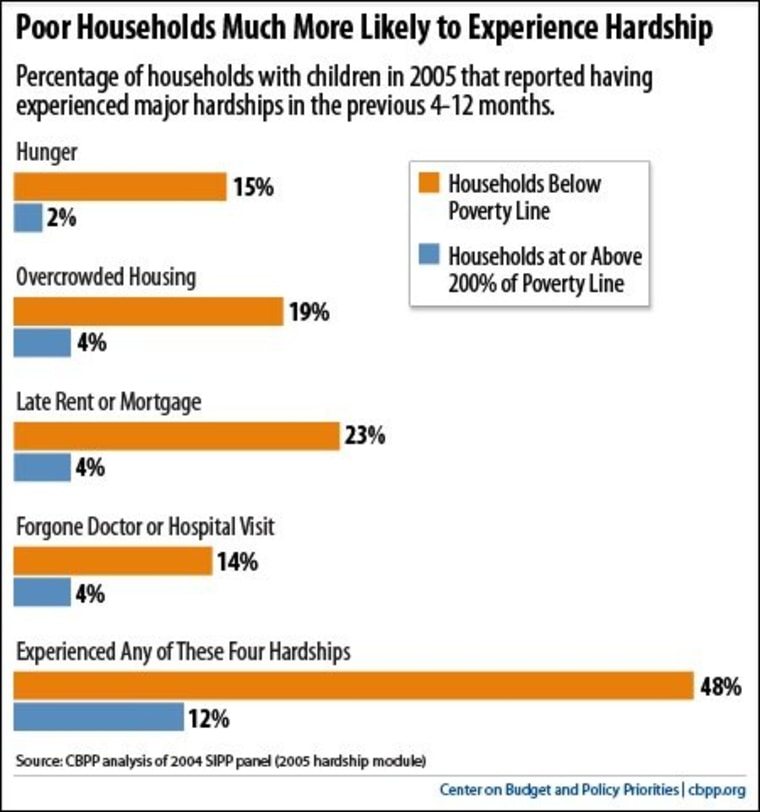
The U.S. Census Bureau brings the news:
Real median household income in the United States in 2010 was $49,445, a 2.3 percent decline from the 2009 median.The nation's official poverty rate in 2010 was 15.1 percent, up from 14.3 percent in 2009 ─ the third consecutive annual increase in the poverty rate. There were 46.2 million people in poverty in 2010, up from 43.6 million in 2009 ─ the fourth consecutive annual increase and the largest number in the 52 years for which poverty estimates have been published.The number of people without health insurance coverage rose from 49.0 million in 2009 to 49.9 million in 2010, while the percentage without coverage −16.3 percent - was not statistically different from the rate in 2009.
At least we've bottomed out for the moment on health insurance. The chart above, from the Center on Budget and Policy Priorities, shows the consequences of life in Poor America.
